The LeadMagic API Reporting Dashboard provides comprehensive insights into your API usage, helping you monitor consumption, track performance, identify issues, and optimize your integration. Whether you're debugging, forecasting costs, or improving efficiency, the dashboard gives you the data you need.
What you can track:
Total API requests and success rates
Credit consumption over time
Daily usage patterns and trends
Response times and performance metrics
Error rates and failed requests
Detailed request logs with full payloads
Billing cycle and renewal timing
Who should use this:
Developers integrating LeadMagic API
GTM teams using Clay, Apollo, or Instantly
Engineering teams monitoring production usage
Finance teams tracking API costs
Product managers analyzing feature adoption
Technical operations monitoring system health
Log in to LeadMagic
Go to app.leadmagic.io
Sign in with your credentials
Navigate to API Dashboard
Click "API" in the main navigation
Select "Reporting" or "Dashboard"
Or go directly to: app.leadmagic.io/api/reporting
Note: You need an active API key to access the dashboard. If you don't have one yet, generate it in Settings > API.
Who can access:
Account owners (full access)
Admins (full access)
Team members with API permissions (read-only in most cases)
What you can see:
All API usage for your account
If you have a team account, you'll see combined team usage
Individual team member API usage (admin view)
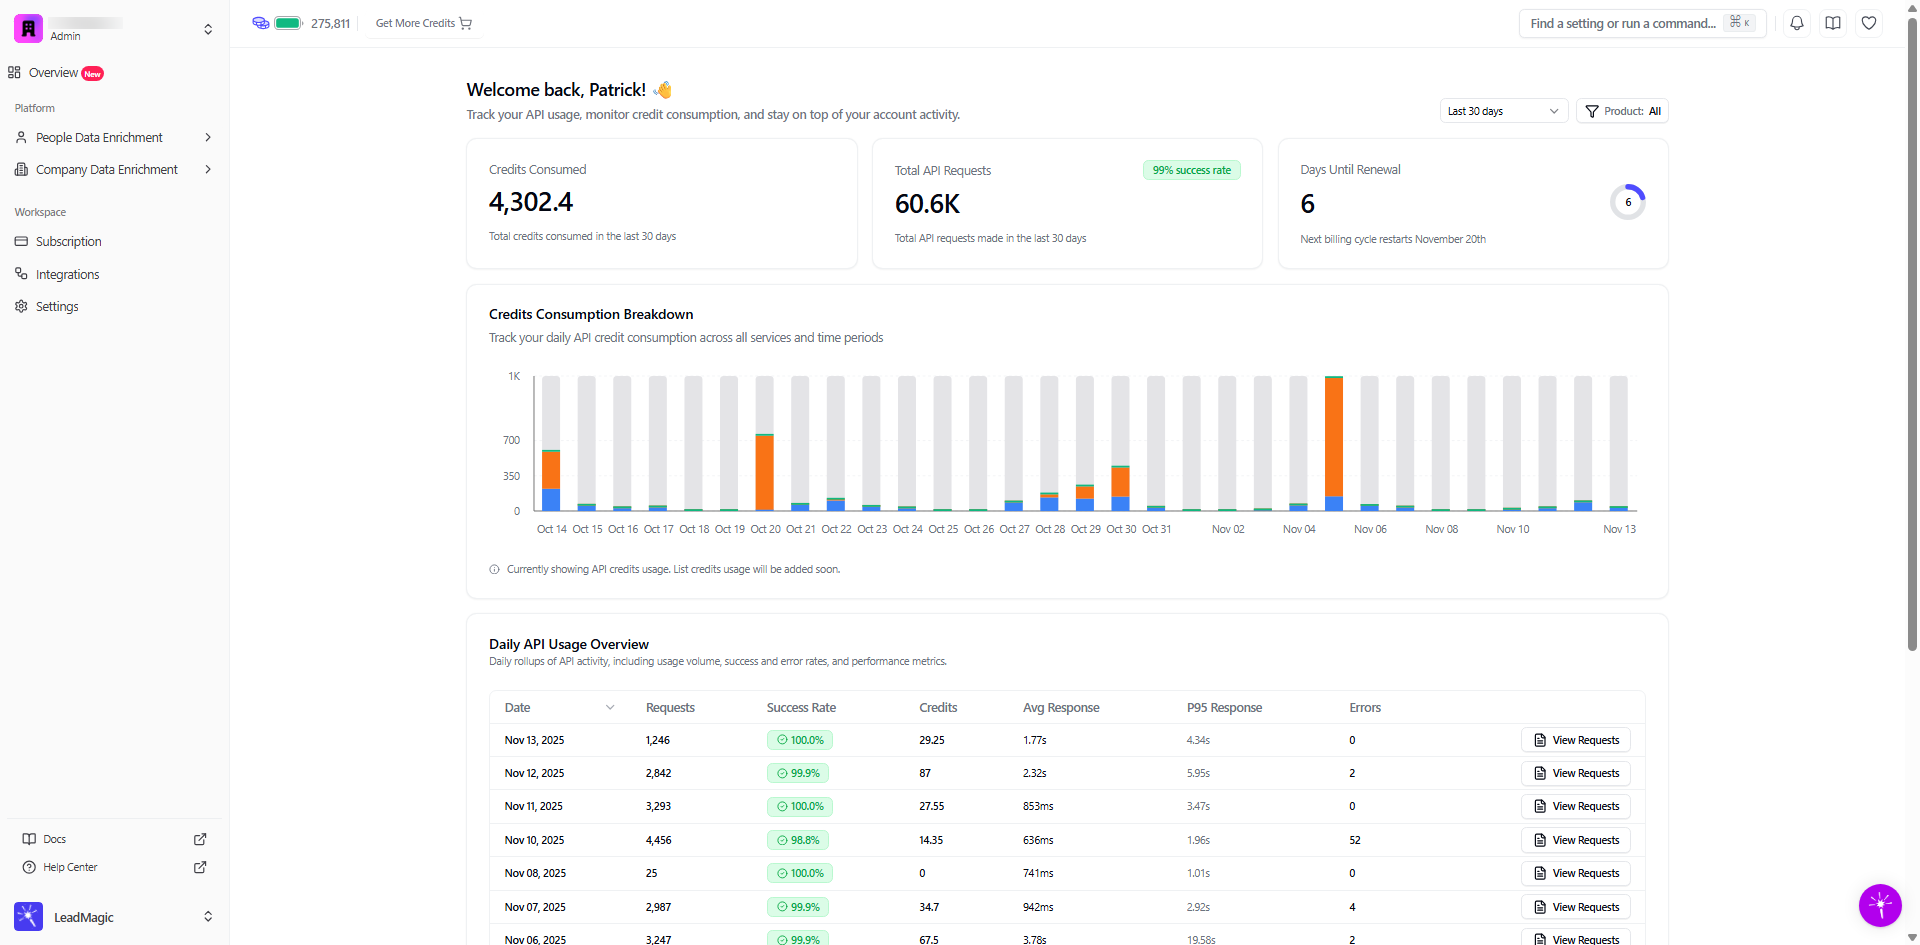
When you open the dashboard, you'll see key metrics at the top providing a quick snapshot of your API health.
What it shows:
Total credits used via API in the last 30 days
Displayed as a single number (e.g., "4,301.7")
Why it matters:
Quick view of monthly API spending
Compare against your subscription allocation
Identify unusual consumption spikes
Forecast future credit needs
Example:
What to watch for:
 Consumption approaching your monthly allocation
Sudden spikes compared to typical usage
 Steady, predictable consumption patterns
Consumption well below allocation (room to grow)
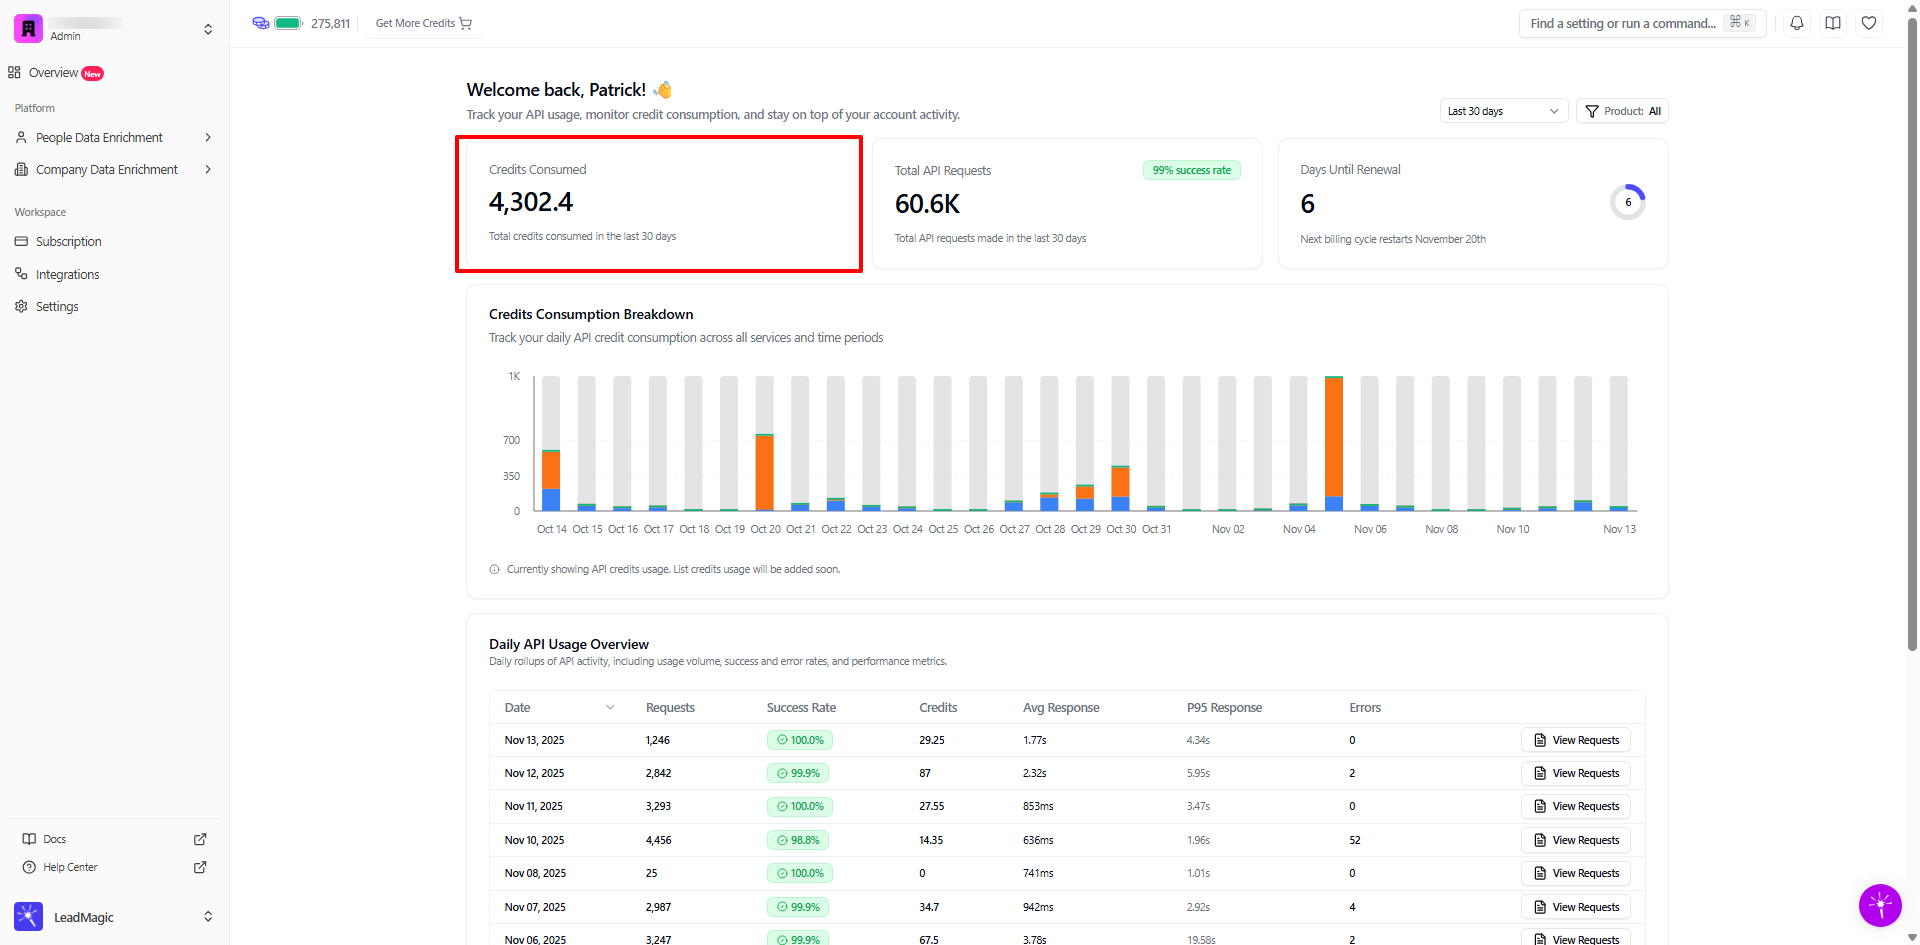
What it shows:
Total number of API calls made in last 30 days
Success rate percentage
Displayed as count + percentage (e.g., "60.6K requests, 99% success rate")
Why it matters:
Measure integration health and reliability
Track volume trends over time
Success rate indicates data quality and API stability
High volume with low success = potential issues
Example:
Success rate benchmarks:
98-100%: Excellent - healthy integration
95-97%: Good - minor issues to investigate
90-94%: Fair - needs attention
Below 90%: Poor - immediate investigation required
Common causes of low success rates:
Invalid input data (malformed emails, incorrect domains)
Rate limiting (too many requests too quickly)
Network/connectivity issues
Incorrect API key or authentication
Using deprecated endpoints
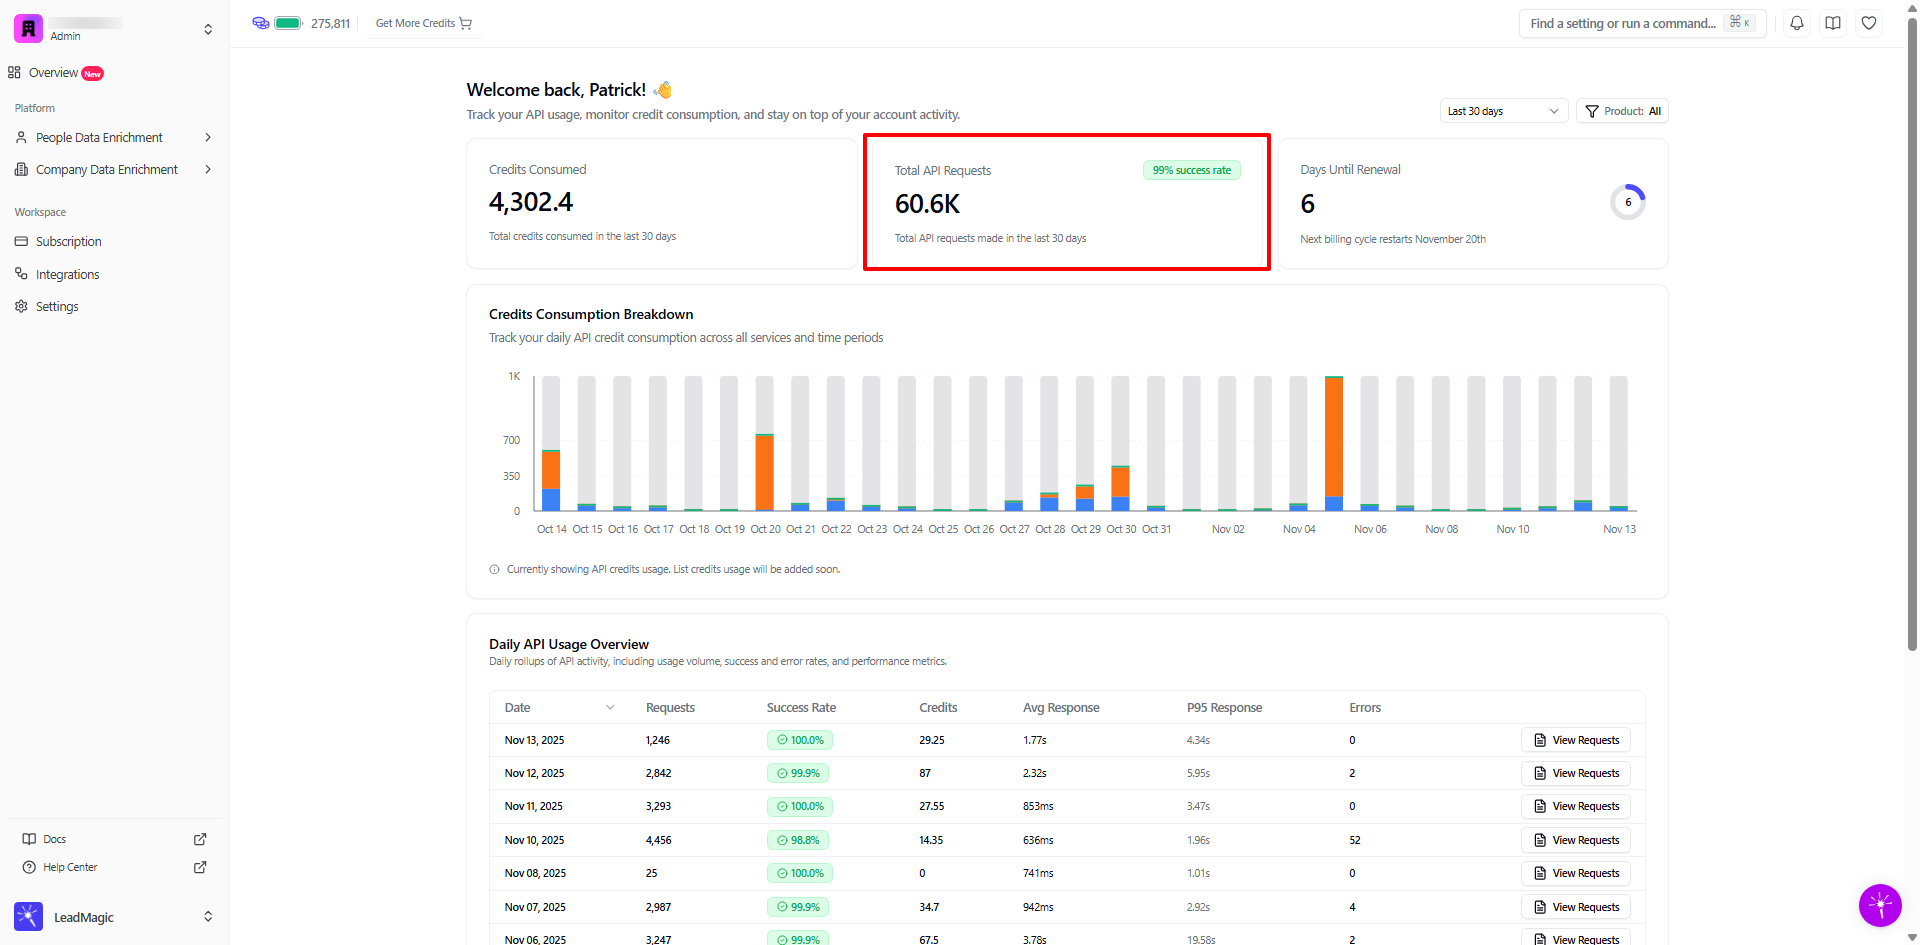
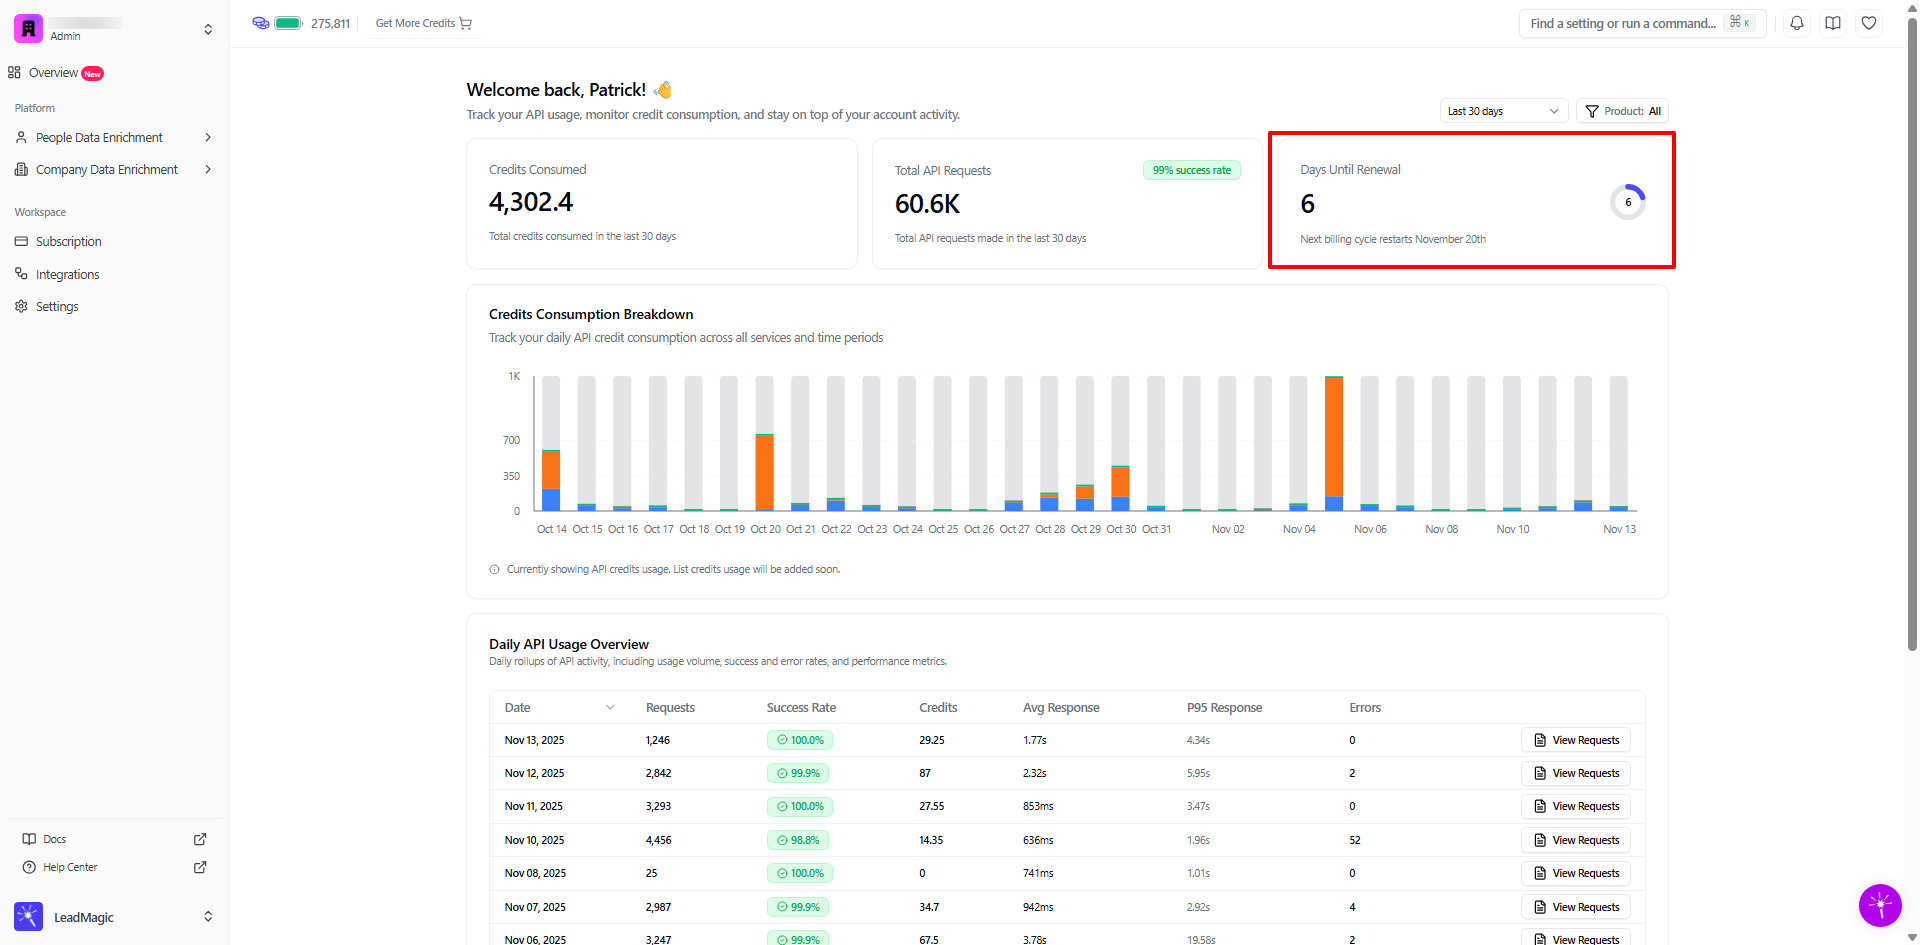
What it shows:
Countdown to next billing cycle
Exact renewal date
Why it matters:
Plan for credit refresh
Time usage appropriately if running low
Prepare for upcoming charges
Schedule heavy usage after renewal if needed
Example:
Usage strategies:
If running low with days remaining: Pace usage or purchase top-up
If abundant credits near renewal: Unused credits may roll over (check plan)
If heavy usage planned: Schedule after renewal for fresh allocation
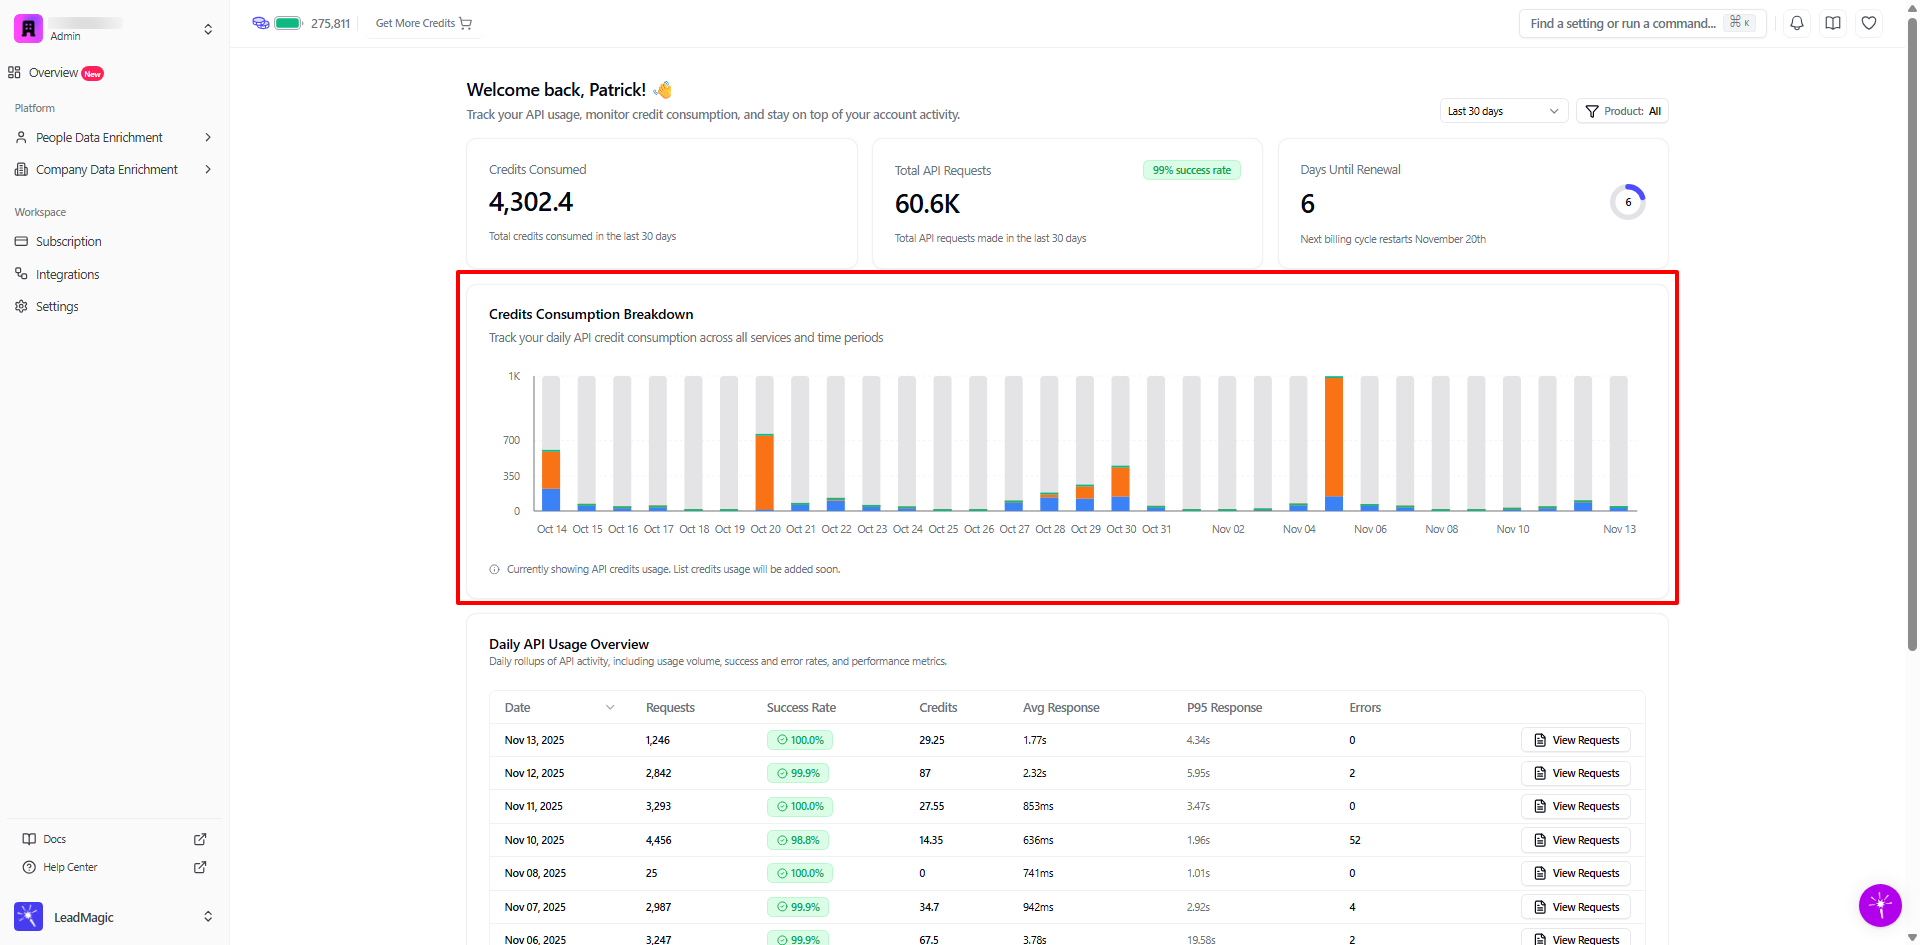
This chart visualizes your daily credit usage over the selected time period, making it easy to spot trends and anomalies.
What you see:
X-axis: Dates (typically last 30 days)
Y-axis: Credits consumed per day
Bars: Height represents daily credit usage
Colors: May differentiate between API products (if multiple)
How to read it:
What to look for:
Healthy patterns:
Consistent daily usage (steady bars)
Expected weekday/weekend patterns (higher weekdays, lower weekends)
Gradual growth as usage scales
Predictable campaign spikes
Warning signs:
Unexpected spikes (investigate cause)
Sudden drops (integration issue?)
Erratic patterns (inconsistent usage)
Trending to zero (broken integration?)
Identify usage patterns:
Pattern 1: Steady Daily Usage
Example: 300-500 credits every day
Indicates: Consistent production integration
Action: Predict monthly usage by multiplying daily average × 30
Pattern 2: Business Hours Pattern
Example: High usage Mon-Fri, low Sat-Sun
Indicates: Business-driven workflows
Action: Ensure credits available for weekday peaks
Pattern 3: Campaign Spikes
Example: Baseline 200/day, spike to 2K on specific day
Indicates: Batch processing or campaign launches
Action: Plan credits accordingly for future campaigns
Pattern 4: Gradual Growth
Example: 100/day increasing to 300/day over weeks
Indicates: Scaling integration
Action: Review plan allocation, consider upgrade
Time period selector:
Last 7 days
Last 30 days (default)
Last 90 days
Custom date range
Product filter:
All products (combined view)
Email Validation only
Work Email only
Mobile Number only
Company Enrichment only
Social Profile only
Use cases for filtering:
By product:
"Which endpoint consumes most credits?"
"Is email validation driving our usage?"
"Should we optimize mobile number usage?"
By time period:
Last 7 days: Recent issues or changes
Last 30 days: Monthly billing cycle analysis
Last 90 days: Long-term trends and growth
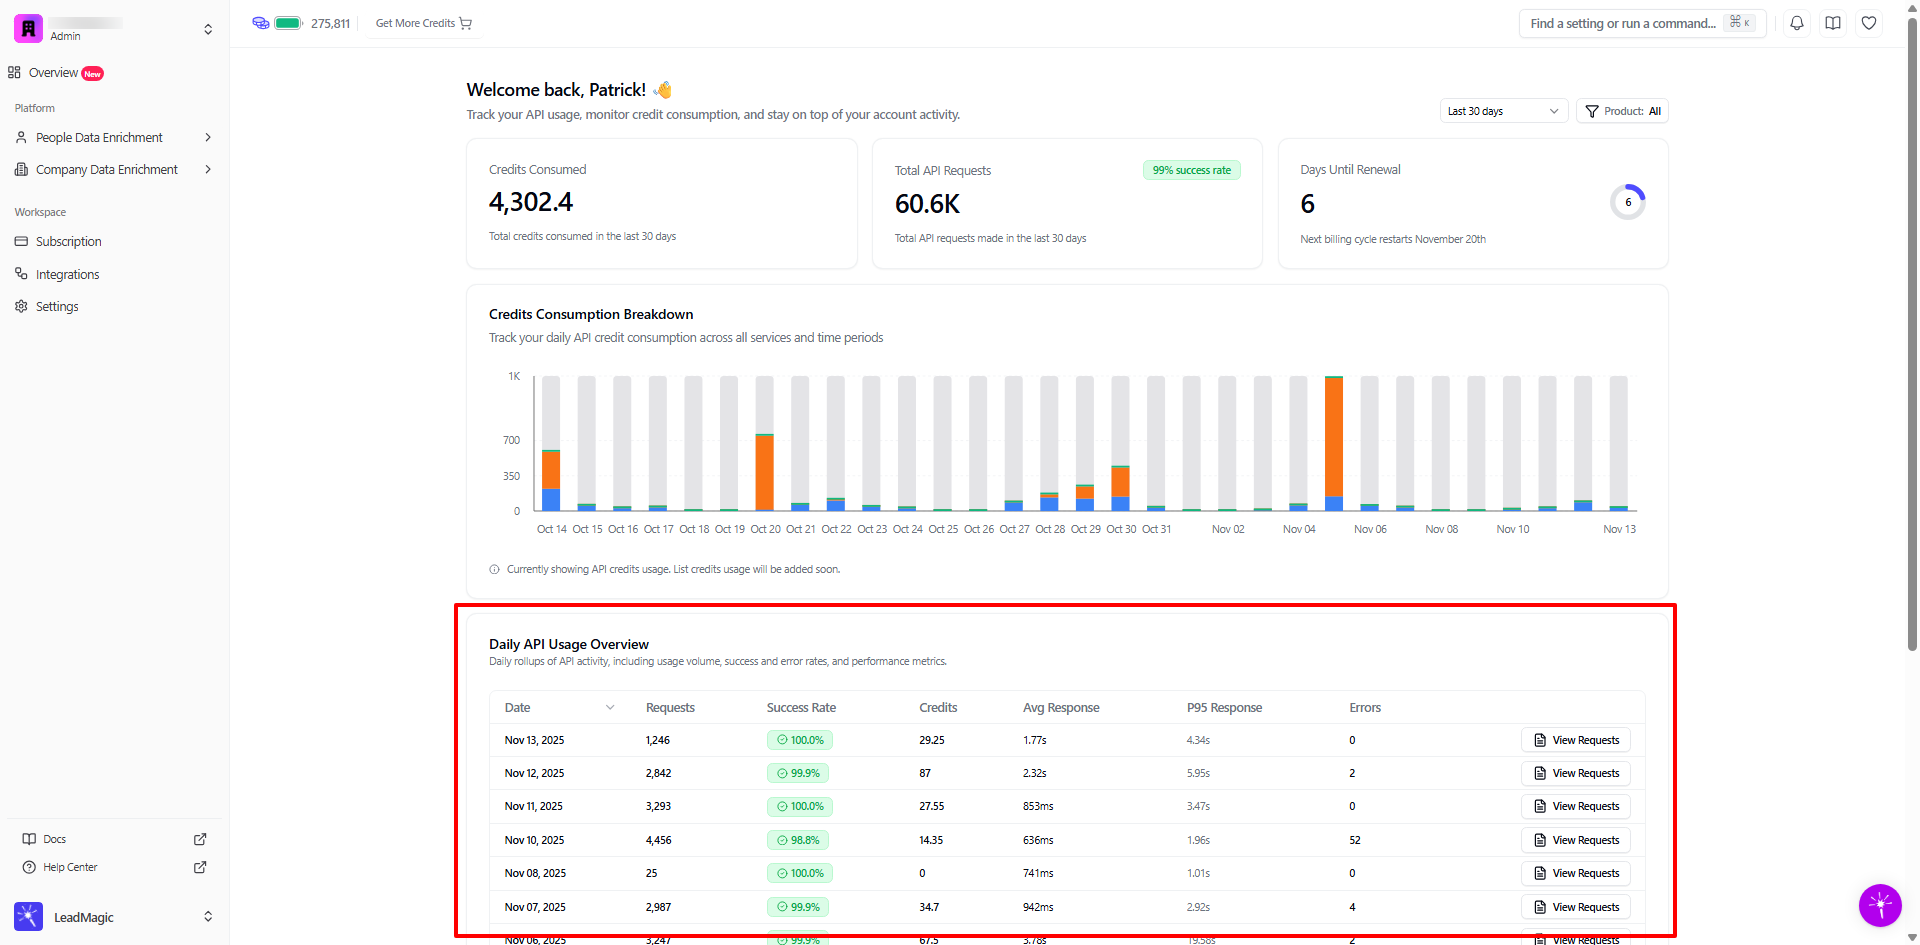
This table provides detailed metrics for each day, giving you granular insights into API performance and reliability.
Date
Calendar date of usage
Click "View Requests" to see detailed logs for that day
Requests
Total API calls made that day
Higher volume = more integration activity
Compare day-over-day for trends
Success Rate
Percentage of successful requests (2xx status codes)
Target: 98%+ for healthy integration
Below 95%: Investigate immediately
Credits
Total credits consumed that day
Compare to request volume for efficiency
Some endpoints cost more credits than others
Avg Response Time
Average time to receive API response
Measured in milliseconds (ms) or seconds (s)
Lower is better for performance
Typical: 500ms - 2s for most endpoints
P95 Response Time
95th percentile response time
Shows slower edge cases (5% of requests take this long or longer)
Important for worst-case performance planning
Should be reasonable (under 5s for most use cases)
Errors
Count of failed requests
Includes 4xx (client errors) and 5xx (server errors)
Zero errors is ideal
Investigate any consistent error patterns
Example: High-performing day
Nov 11, 2025
Requests: 3,293
Success Rate: 100.0%
Credits: 27.55
Avg Response: 853ms
P95 Response: 3.47s
Errors: 0
Analysis:
High volume with perfect success rate
Low credit usage (efficient requests)
Fast average response time
P95 under 5s (good performance)
Zero errors (healthy integration)
Example: Problem day
Nov 05, 2025
Requests: 7,672
Success Rate: 95.9%
Credits: 1,320.9
Avg Response: 3.04s
P95 Response: 8.79s
Errors: 315
Analysis:
High volume but lower success rate
Very high credit usage
Slower than average response times
315 errors (4.1% error rate)
 Click "View Requests" to investigate errors
Possible causes:
Batch processing with invalid input data
Rate limiting (too many requests too fast)
Network issues or timeouts
Bug in integration code
Data quality problems
Sort by any column:
Date (chronological order)
Requests (find highest/lowest volume days)
Success Rate (identify problem days)
Credits (find most expensive days)
Response Time (performance analysis)
Errors (troubleshooting)
Use cases:
Sort by Credits (descending):
Find most expensive days
Identify cost optimization opportunities
Plan budget for similar future usage
Sort by Success Rate (ascending):
Find days with most failures
Prioritize troubleshooting efforts
Identify patterns in errors
Sort by Errors (descending):
See all problem days at once
Investigate root causes
Track error trends over time
Click "View Requests" on any day to see individual API calls with full details.


Timestamp
Exact time of API call (HH:MM:SS)
Timezone: Your account timezone
Useful for correlating with application logs
Product
Which LeadMagic product was called
Examples: Email Validation, Find Work Email, Mobile Number, Company Enrichment
Helps identify which features drive usage
Endpoint
API endpoint path
Examples: /email-validate, /work-email, /mobile-number
Direct correlation to your code
Credits
Credits consumed by this specific request
0 = Failed request (no charge)
1 = Successful single enrichment
Higher = Successful multi-credit endpoint
Status Code
HTTP status code returned
200 = Success
400-499 = Client error (your side)
500-599 = Server error (our side)
Response Time
How long this specific request took
Measured in milliseconds (ms) or seconds (s)
Helps identify slow requests
Request Body
Input data you sent
JSON formatted
Example: {"email":"[email protected]"}
Response Body
Data we returned
JSON formatted (usually truncated in table)
Click to expand full response
Successful request:
Timestamp: 00:55:57
Product: Email Validation
Endpoint: /email-validate
Credits: 0
Status: 200
Response Time: 1.1s
Request Body: {"email":"[email protected]"}
Response Body: {"email":"[email protected]","email_status":"unknown"...}
Why 0 credits? Email validation typically doesn't charge credits, or charges based on validation type. Check your plan for specifics.
Failed request example:
Timestamp: 02:34:12
Product: Work Email
Endpoint: /work-email
Credits: 0
Status: 400
Response Time: 234ms
Request Body: {"first_name":"John","last_name":"","domain":"example.com"}
Response Body: {"error":"last_name is required"}
Analysis:
Status 400 = Client error
Missing required field (last_name)
No credits charged (failed request)
Quick response (error caught early)
Action: Fix validation in your code
Filter by Product:
See only Email Validation requests
Isolate Work Email searches
Focus on Mobile Number lookups
Analyze Company Enrichment calls
Filter by Status:
All statuses (default)
Success only (200s)
Client errors (400s)
Server errors (500s)
Use cases:
"Show me all errors"
Filter Status: 400s and 500s
Identify error patterns
Find common failure reasons
Fix integration issues
"Show me slow requests"
Sort by Response Time (descending)
Identify performance bottlenecks
Optimize timeout settings
Report consistently slow endpoints
"What drove credit usage on this day?"
Sort by Credits (descending)
See which requests cost most
Identify expensive batch operations
Optimize credit consumption
Scenario: Your application is returning unexpected results or errors.
Steps:
Go to Daily API Usage Overview
Sort by Success Rate (ascending) to find problem days
Click "View Requests" on affected days
Filter by Status: 400s and 500s
Review error responses for common patterns
Check request bodies for data quality issues
Correlate timestamps with your application logs
Common findings:
Missing required fields in request body
Malformed email addresses or domains
Rate limiting (429 errors)
Authentication issues (401 errors)
Scenario: Your credit consumption is higher than expected.
Steps:
Review Credits Consumption Breakdown chart
Identify days with unusual spikes
Click "View Requests" on high-consumption days
Sort by Credits (descending)
Look for patterns:
Multiple calls for same data (cache instead)
Failed requests retrying repeatedly
Unnecessary validation calls
Optimize code to reduce redundant requests
Optimization strategies:
Cache enrichment results (TTL: 30-90 days)
Batch requests when possible
Validate input data before API calls
Implement request deduplication
Use conditional logic to skip unnecessary enrichments
Scenario: Planning to scale your integration or launch new features.
Steps:
Analyze Credits Consumption Breakdown over 90 days
Calculate average daily usage
Identify growth trends (linear, exponential)
Factor in planned features or campaigns
Estimate future credit needs
Compare to current plan allocation
Example calculation:
Current average: 200 credits/day
Current monthly: 6,000 credits
Planned 3x scale: 18,000 credits/month
Current plan: 10,000 credits/month
Recommendation: Upgrade to plan with 20,000+ credits
Scenario: Ensuring your integration meets SLA requirements.
Steps:
Review Avg Response Time and P95 Response across days
Set acceptable thresholds (e.g., avg <1s, P95 <3s)
Identify days exceeding thresholds
Investigate slow requests on those days
Check for patterns:
Specific endpoints consistently slower
Time of day correlation
Request size impact
Optimize or adjust timeouts accordingly
Response time targets:
Avg Response < 1s: Excellent for real-time applications
Avg Response 1-2s: Good for most use cases
Avg Response 2-5s: Acceptable for background jobs
Avg Response > 5s: May need optimization or investigation
Scenario: Multiple teams using same API key; need to attribute costs.
Steps:
Review Daily API Usage for date ranges
Export request logs (if feature available)
Group by Product to see per-feature costs
Cross-reference with team deployment timelines
Calculate credits per team/feature
Use for chargeback or budget planning
Better approach: Consider using separate API keys per team for automatic attribution.
Average Response Time:
Mean time across all requests
Good for understanding typical performance
Can be skewed by outliers
Target: < 2s for most endpoints
P95 Response Time:
95% of requests complete within this time
Better indicator of user experience
Captures slower edge cases
Target: < 5s for most endpoints
Why both matter:
Avg = typical case
P95 = worst reasonable case
If Avg is good but P95 is bad = inconsistent performance
If both are bad = systemic performance issue
Formula:
Success Rate = (Successful Requests / Total Requests) × 100
Successful = Status codes 200-299
Failed = Status codes 400-499, 500-599
Success rate targets by use case:
Production real-time: 99%+ required
Background jobs: 95%+ acceptable
Experimental/testing: 90%+ okay
Improving success rates:
Validate input data before sending
Implement proper error handling
Retry failed requests with exponential backoff
Monitor and fix data quality issues
Check API documentation for requirements
Symptoms:
Credits depleting faster than expected
Unexplained spikes in consumption
Running out mid-month
Diagnosis:
Check Credits Consumption Breakdown for spikes
Review high-credit days in detail
Look for duplicate requests (same input)
Check for retry loops on failures
Identify inefficient usage patterns
Solutions:
Implement caching (30-90 day TTL)
Add request deduplication logic
Fix retry logic (use exponential backoff)
Validate data quality before API calls
Consider batching requests
Symptoms:
Success rate below 95%
Many 400 or 500 errors
Integration not working reliably
Diagnosis:
Filter request logs by Status: 400s
Review error messages in response bodies
Check for common error patterns
Validate request body format
Verify authentication
Common causes:
Missing required fields
Invalid data format (email, domain)
Rate limiting (too many requests)
Expired or invalid API key
Network connectivity issues
Solutions:
Validate inputs before sending
Check API documentation for requirements
Implement rate limiting on your side
Verify API key is valid
Add error handling and retries
Symptoms:
Avg Response > 3s consistently
P95 Response > 10s
Application timeouts
Diagnosis:
Sort requests by Response Time
Identify consistently slow endpoints
Check request body size
Review time of day patterns
Test network latency
Common causes:
Large batch requests
Network latency issues
High load on LeadMagic systems
Geographic distance to API servers
Client-side timeout settings too aggressive
Solutions:
Break large batches into smaller chunks
Implement parallel processing
Set appropriate timeout values (30s+)
Consider caching for repeated queries
Contact support if consistent slow performance
Symptoms:
Dashboard shows no data
Recent requests not appearing
Counts don't match expectations
Diagnosis:
Verify you're using correct API key
Check date range filter
Confirm requests are actually being sent
Review product filter (not filtered out)
Wait 5-10 minutes for data sync
Solutions:
Refresh page
Clear date range filters
Select "All Products" in filter
Check your application logs to verify API calls
Allow time for data to sync (up to 10 minutes)
Symptoms:
Sudden increase in 500 errors
Previously working integration fails
Inconsistent error responses
Diagnosis:
Check LeadMagic status page
Review recent code changes
Compare error timestamps across requests
Check for LeadMagic API updates/changes
Review response bodies for error details
Solutions:
Check status.leadmagic.io (if exists)
Rollback recent code changes
Implement retry logic with backoff
Contact support with example request IDs
Update integration if API changed
Daily:
Quick glance at success rate
Check for error spikes
Verify credit consumption is normal
Weekly:
Review Credits Consumption Breakdown
Analyze daily trends
Investigate any anomalies
Check average response times
Monthly:
Deep dive into usage patterns
Calculate cost per enrichment
Plan for next billing cycle
Review optimization opportunities
Forecast future needs
The dashboard updates in real-time as APIs are used and take only seconds to appear in the logs.
The dashboard shows API credit usage only. Your total billing includes Manual CSV uploads (list credits). Check Settings > Billing for complete credit usage.
Some scenarios result in 0 credit charges:
Failed requests (4xx/5xx errors)
Email validation on certain plans
Check the response body and status code to understand why no credits were charged.
Focus on data quality:
Validate inputs before sending to API
Handle required fields properly
Format emails and domains correctly
Implement proper error handling
Avoid rate limiting (pace requests)
Targets by use case:
Real-time applications: Avg < 1s, P95 < 3s
Background jobs: Avg < 3s, P95 < 10s
Batch processing: Avg < 5s, P95 < 15s
LeadMagic doesn't have built-in alerting yet.
The dashboard typically shows the last 90 days of data. Older data may not be available unless exported previously.
api dashboard, api reporting, api usage, api metrics, api analytics, track api usage, monitor api calls, api consumption, api credits usage, api performance, api response time, api success rate, api error rate, view api requests, api request logs, api request history, api call history, detailed api logs, api debugging, troubleshoot api, api cost tracking, api billing, api credit consumption, daily api usage, monthly api usage, api usage breakdown, api usage chart, api usage graph, api performance metrics, api monitoring, api observability, api insights, api statistics, track enrichment usage, monitor enrichment calls, enrichment analytics, leadmagic api analytics, leadmagic api dashboard, leadmagic usage tracking, how to view api usage, where to see api calls, api request details, api response time, slow api requests, api errors, failed api requests, api success rate low, optimize api usage, reduce api costs, api best practices, api performance optimization, api rate limiting, api troubleshooting, export api data, download api logs, api reporting export
